AI Visibility KPIs: What to Track and How to Report It
AI visibility does not come with a standard reporting template. This guide defines the primary and secondary KPIs that matter, explains how to structure weekly, monthly, and quarterly reporting cycles, and shows how to present AI visibility data to stakeholders who are used to thinking in SEO and paid media terms.
Why AI Visibility Needs Its Own KPI Framework
Most marketing teams already track organic rankings, impressions, click-through rates, and conversion metrics. Those frameworks were built for search engines with indexed pages and observable positions. AI platforms do not work that way. There is no position zero to win. There is no rank-tracking dashboard you can log into and see where you landed. Instead, AI platforms generate fresh answers for each query, and your brand either appears in those answers or it does not.
That structural difference means you cannot map AI visibility onto existing SEO reporting templates and call it done. You need a new set of KPIs, a new measurement cadence, and a new way of presenting the data to people who may not yet understand why it matters.
The good news is that the KPI framework for AI visibility is not complicated. It has a small number of primary metrics that serve as headline numbers, a layer of secondary metrics that explain the headline, and a reporting rhythm that keeps stakeholders informed without requiring weekly all-hands meetings.
This guide builds that framework from scratch, starting with the metrics that matter most.
Primary KPIs: The Numbers That Go in Every Report
Primary KPIs are the metrics you track every reporting period and include in every stakeholder update. They should be simple enough to explain in one sentence and meaningful enough to drive decisions. For AI visibility, there are four.
Visibility Score
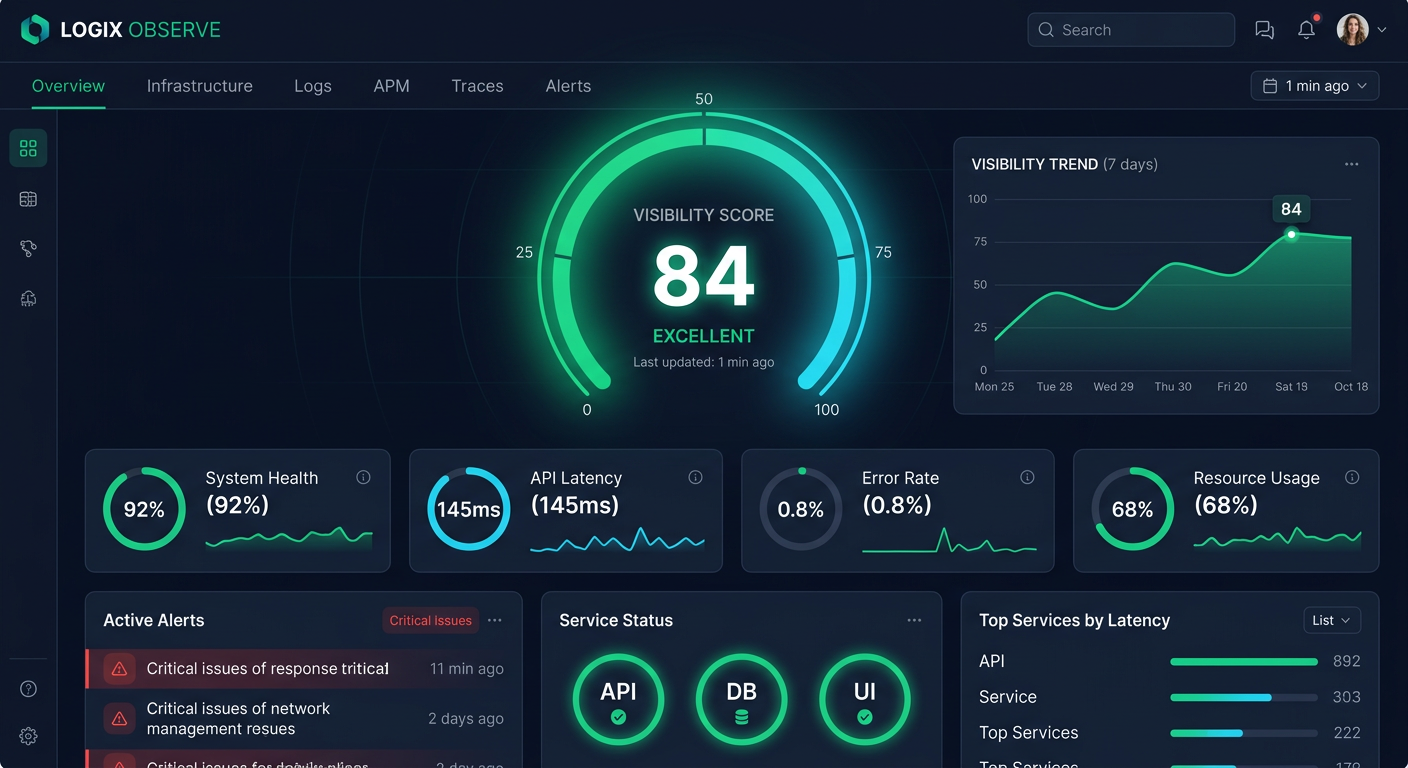
The Visibility Score is a composite metric on a zero-to-one-hundred scale that measures overall AI brand presence across your monitored platforms and prompts. It is the single most useful headline number for AI visibility reporting because it compresses multiple signals into one figure that stakeholders can track over time.
Prompt Eden's Visibility Score is built from four components: Presence (does the AI mention your brand at all), Prominence (how central is the mention), Ranking (where you appear relative to other brands named in the same response), and Recommendation (does the AI actively recommend you or just acknowledge your existence). Each component captures something the others miss. Together, they produce a score that moves meaningfully in response to real changes in how AI platforms treat your brand.
Report the Visibility Score as your headline number. Report the trend direction alongside it. A score on its own means little without context. A score that has risen fourteen points over six weeks tells a clear story.
AI Share of Voice
Share of voice (SOV) is a competitive metric. It measures the percentage of AI responses where your brand appears compared to all competitor brands across your monitored prompts. The formula is straightforward: divide your brand mentions by total brand mentions across all competitors, then multiply by one hundred.
SOV answers a question that Visibility Score does not: how are you doing relative to the competition? Your Visibility Score can be improving while your SOV is declining because a competitor is gaining ground faster than you are. Track both.
Define your competitive set carefully. A well-focused SOV calculation compares you to direct competitors for a defined prompt set. Broadening the comparison to the entire market creates noise that is hard to act on.
Citation Rate
Citation rate measures the percentage of AI responses that include a cited source when mentioning your brand. This matters for two reasons.
First, a higher citation rate indicates that AI platforms are actively retrieving and referencing your content rather than drawing only on training data. That distinction has practical implications: content that gets cited tends to get mentioned more consistently across platforms and over time.
Second, citation rate is a leading indicator. When your citation rate rises before your Visibility Score does, it usually means AI platforms are starting to engage more actively with your content ecosystem. When citation rate drops without an obvious cause, it often signals that a technical change (like a robots.txt update or a site restructure) has reduced crawler access to your material.
Recommendation Rate
Recommendation rate is the percentage of AI responses where your brand is not just mentioned but actively recommended as a solution or primary choice. The difference between a mention and a recommendation is significant. An AI might mention ten brands in a single response and recommend one. Being on the mention list is different from being the answer.
Recommendation rate is the metric most closely tied to purchase intent. When a buyer asks an AI "what tool should I use for X," the brands that get recommended are the ones that influence the decision. Track this separately from general presence to understand how often AI is actively directing buyers toward your product.
Secondary KPIs: The Metrics That Explain the Headlines
Secondary KPIs support the primary metrics. They help you understand why a headline number moved and where to focus improvement efforts. You do not need to include all of them in every stakeholder report, but you should be tracking them internally on a regular basis.
Platform Coverage
Platform coverage measures how many AI platforms mention your brand for your target prompts, out of the total platforms you monitor. A brand that appears consistently across ChatGPT, Claude, Perplexity, Gemini, and Google AI Overviews has much broader coverage than one that appears on only two of those platforms.
Platform coverage matters because AI platforms draw from different data sources and use different retrieval mechanisms. A brand can be strong on ChatGPT, which reached over 800 million weekly active users as of early 2026, and largely invisible on Gemini or Claude. If your buyers use multiple platforms across their research process, a platform concentration problem in your coverage translates directly to missed consideration.
Track platform coverage as a count (for example, you appear on five of nine monitored platforms) and watch for gaps that open up or close as you publish new content or build citation sources.
Citation Source Diversity
This secondary metric measures how many distinct domains AI platforms cite when mentioning your brand. A brand cited only from its own website has a single point of failure. If that site goes down, gets restructured, or gets blocked by an AI crawler, the citation signal disappears entirely.
Citation source diversity tracks the breadth of your third-party footprint. The goal is to have AI platforms citing your brand from industry publications, review platforms, comparison resources, and independent editorial sources, not just from pages on your own domain.
Prompt Eden's Citation Intelligence shows exactly which domains AI references when discussing your brand, including top cited domains, Reddit mentions, and YouTube mentions. That breakdown tells you which third-party sources are already working and where the gaps are.
Prompt-Level Presence Rate
Prompt-level presence rate breaks down your overall Visibility Score by individual prompt. It tells you which queries produce mentions and which produce silence. This is the diagnostic layer that makes the headline metrics actionable.
For example, an above-average Visibility Score might look uniform in a chart. But at the prompt level, you might find that you appear in nearly every response to category queries and almost never appear in comparison queries. That breakdown completely changes what you should work on next.
Review prompt-level presence rate monthly as part of your standard analysis, and use it to prioritize your content roadmap.
How to Structure Reporting: Weekly, Monthly, and Quarterly
Different stakeholders need different kinds of information at different intervals. A reporting cadence that tries to satisfy everyone with a single monthly summary usually satisfies no one. Here is a practical three-tier structure.
Weekly Checks (Internal Team)
Weekly reporting is not about presenting to leadership. It is about keeping your team informed and catching changes before they compound.
A weekly check should take no more than thirty minutes and cover four things:
- Did the Visibility Score move by more than three points in either direction?
- Did any new competitor brands appear in AI responses that were not there before?
- Did citation sources shift? Are new domains appearing or are established sources dropping out?
- Did any platform show a significant gain or loss compared to last week?
The format is simple: a short written summary with the current numbers compared to the prior week, and a note on what changed and why. If nothing material changed, say that. Flat weeks are still useful data.
Teams on Prompt Eden's Starter ($49/month) or Pro ($129/month) plans can pull daily data and use weekly check-ins to review the accumulated daily signals. That daily data collection provides trend continuity even when your formal review happens weekly.
Monthly Reports (Marketing and Brand Teams)
Monthly reports go to a broader audience: marketing leads, brand managers, content strategists, and anyone involved in the programs that affect AI visibility. This is where you connect the metrics to the work.
A strong monthly report covers six elements:
Headline metrics. Visibility Score (current and trend), AI share of voice, citation rate, and recommendation rate. Include a one-sentence interpretation of each number, not just the number itself.
Platform breakdown. Which platforms improved, which declined, and which stayed flat. Include the platform coverage count and flag any platforms where you had significant movement.
Competitive position. SOV compared to your defined competitor set, with a note on any competitors gaining or losing ground. If Organic Brand Detection surfaced any new entrants in AI responses this month, include them here.
Citation sources. The top domains AI cited when mentioning your brand, and any notable changes to that list. Flag if a high-authority third-party source started or stopped appearing.
Prompt-level highlights. Two or three specific prompts where performance improved or declined significantly, with a hypothesis about why.
Actions taken and planned. What content or technical changes did the team make this month? What is planned for next month? Connecting actions to metrics is what makes the report useful rather than just informational.
Keep the monthly report to two or three pages, or the equivalent in slides. The goal is a document that someone can read in ten minutes and walk away from knowing whether things are moving in the right direction and what the team is doing about it.
CSV export is available on paid plans if your team prefers to pull raw data and build custom views.
Quarterly Reviews (Executives and Leadership)
Quarterly reviews are where AI visibility gets connected to business outcomes. This is the audience that needs context before metrics, and outcomes before tactics.
Structure a quarterly review in three parts.
Part one: what changed and why it matters. Show the trend for the past quarter across primary KPIs. Frame it in terms leadership already cares about: brand health, competitive position, and buyer consideration. Avoid jargon. Replace "citation rate" with "how often AI platforms reference our content as a source" if needed.
Part two: competitive context. Show AI share of voice relative to your competitive set. If you gained ground, explain what drove it. If you lost ground, explain what you are doing about it. Leadership needs to understand that AI visibility is a competitive channel, not just a vanity metric.
Part three: business connection. This is the hardest part and the most important. Connect your AI visibility trend to business outcomes your audience already tracks. If your Visibility Score rose by fourteen points this quarter while a campaign was running, and that campaign period correlated with stronger inbound volume, make that connection explicit even if causation is hard to prove. Attribution in AI visibility is still early, but directional connections are worth drawing.
End every quarterly review with a forward-looking summary: what you expect to improve next quarter, what you need to make that happen, and what risks might prevent it.
Presenting AI Visibility to Executives
The biggest reporting challenge with AI visibility is not the data. It is the translation problem. Most executives are fluent in Google Analytics, paid media dashboards, and traditional SEO rankings. None of those mental models map cleanly onto AI visibility metrics. If you walk into a leadership meeting and start explaining Visibility Scores without context, you will spend the whole meeting on definitions and never get to decisions.
Here are five principles for presenting AI visibility to executives in a way that actually lands.
Start with the channel, not the metric
Before showing any numbers, establish why AI search is worth tracking. Users ask AI platforms questions that used to go to Google. When they do, AI generates an answer that may or may not include your brand. The brands that appear in those answers are being recommended to buyers at the moment they are forming their consideration set. That is the business context. The metrics follow from it.
You do not need to spend more than two minutes on this setup, but skipping it entirely means your metrics will land without a frame.
Use analogies to familiar metrics
AI Visibility Score is like a quality score for how AI perceives your brand. AI share of voice is like paid media SOV, but in generated answers instead of ad inventory. Citation rate is like referring domains in SEO, showing how many independent sources support your brand's presence in AI answers.
These analogies are imperfect, but they are accurate enough to give leaders a foothold. Once they have a mental model, you can add nuance.
Lead with trend, not absolute value
A Visibility Score means nothing to someone seeing it for the first time without context. A Visibility Score that rose substantially over four months while a competitor's declined means something very clear. Always show the trend line before the current number. Context makes the current value interpretable.
Connect to pipeline or brand health when you can
AI visibility has soft attribution challenges that are similar to brand advertising. You cannot always draw a direct line from a Visibility Score increase to a closed deal. But you can show that periods of stronger AI visibility correlate with stronger inbound lead quality, shorter sales cycles for deals that mention AI research in their journey, or improved performance on brand awareness surveys.
Build those correlations over time. Even imperfect correlation is more persuasive than a metric in isolation.
Frame the competitive risk clearly
Leaders respond to competitive framing. AI share of voice falling from 38% to 29% over a quarter is easy to dismiss if it is framed as a technical metric. The same data framed as "competitors captured nine points of category presence in AI-generated answers over the past quarter, and we know which competitor and which prompts drove that shift" creates urgency.
Use your SOV data and platform-level breakdown to make the competitive picture concrete. Names and numbers are more compelling than percentages alone.
Connecting AI Visibility to Business Outcomes
The long-term goal of AI visibility reporting is to connect the metrics to outcomes that leadership already cares about. That connection is not automatic, and the industry is early enough that there is no established playbook for attribution. But there are practical approaches that work.
Brand awareness and consideration surveys
If your company runs quarterly or annual brand health surveys, add questions about how respondents learned about or considered your brand. Over time, watch for shifts in "AI assistant or chatbot" as a discovery source. Rising AI visibility should correlate with rising AI-as-discovery-channel responses, especially among younger buyers who use AI tools more frequently.
Inbound lead source tagging
If your CRM captures how leads heard about you, create a category for AI search. Sales and support teams can ask buyers during onboarding or first calls. Even informal data collection over several quarters can reveal whether high-AI-visibility periods produce proportionally more AI-attributed inbound leads.
Content performance correlation
When you publish a piece of content specifically designed to improve AI visibility for a target prompt, track both the AI visibility change for that prompt and any organic traffic or engagement change for the content itself. Strong AI visibility for a query often correlates with content that also performs well in traditional search because the signals that make content citable for AI (clear structure, specific claims, authoritative sources) tend to produce quality traditional search content too.
Competitive intelligence value
One underreported business value of AI visibility tracking is competitive intelligence. Organic Brand Detection surfaces competitors appearing in your category's AI responses, including brands you may not have been watching. That discovery layer has intelligence value beyond the metric itself. Include notable competitive findings in quarterly reviews as a way to demonstrate that your AI visibility program produces strategic information, not just performance data.
None of these connections will produce a clean attribution model in your first quarter of tracking. The goal is to build a body of directional evidence over time. As AI search continues to grow as a buyer research channel, the evidence base will strengthen and the business case for investment in AI visibility will become self-evident from the data.